Basic status of HHR in China
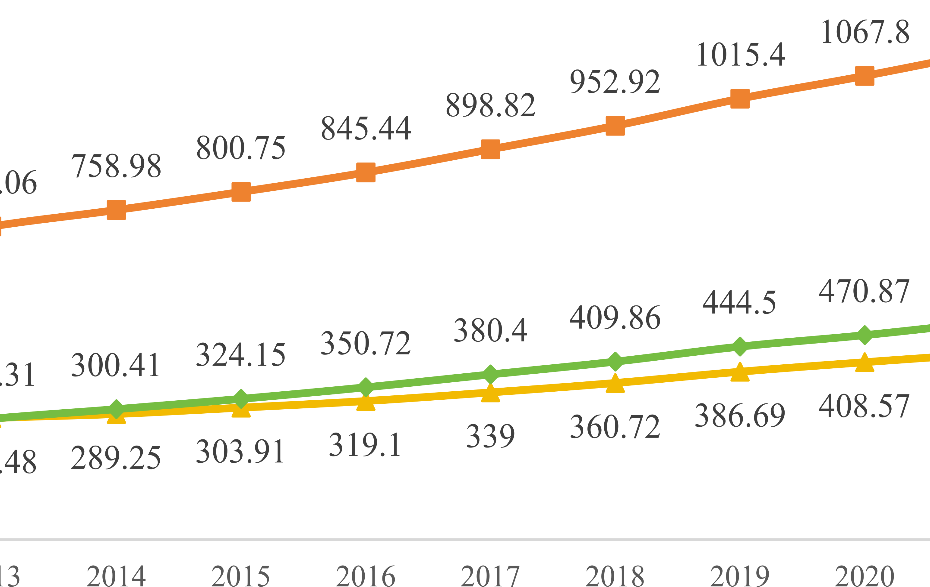
The total HT in China increased from 6.6755 million in 2012 to 11.2442 million in 2021, while the total L(A)P increased from 2.6161 million in 2012 to 4.2876 million in 2021. Additionally, the total RN increased from 2.4966 million in 2012 to 5.0194 million in 2021. The average annual growth rates from 2012 to 2021 for HT, L(A)P, and RN were 5.96%, 5.64%, and 8.07%, respectively (Fig. 1).
Trends of HHR in China (10,000 population)
In 2021, China had 79.64 HT per 10,000 population, 30.40 L(A)P per 10,000 population, and 35.58 RN per 10,000 population. Among them, 15 regions, including Hebei and Liaoning, had lower than average HT per 10,000 population. 16 regions, including Anhui and Fujian, had lower than average L(A)P per 10,000 population. 11 regions, including Tianjin and Hebei, had lower than average numbers of RN per 10,000 population.
In addition, China had 11,688.92 HT per 10,000 square kilometers, 4,461.14 L(A)P per 10,000 square kilometers, and 5,222.58 RN per 10,000 square kilometers in 2021. 9 regions, including Inner Mongolia and Jilin, had lower than average HT per 10,000 square kilometers. 8 regions, including Inner Mongolia and Heilongjiang, had lower than average L(A)P per 10,000 square kilometers. 9 regions, including Inner Mongolia and Jilin, had lower than average numbers of RN per 10,000 square kilometers. Meanwhile, 7 regions, including Beijing and Shanxi, had significantly higher values for all indicators than the national average (Table 1).
Lorenz curve and Gini coefficient
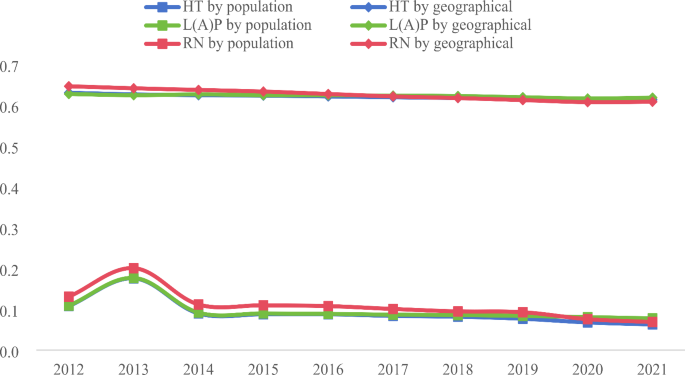
From 2012 to 2021, China’s Gini coefficient for HT distribution based on population decreased from 0.108 to 0.063, while the Gini coefficient for HT distribution based on geographical decreased from 0.631 to 0.614. The Gini coefficient for L(A)P distribution based on population decreased from 0.109 to 0.078, while the Gini coefficient for L(A)P distribution based on geographical decreased from 0.628 to 0.619. Similarly, the Gini coefficient for RN distribution based on population decreased from 0.131 to 0.069, while the Gini coefficient for RN distribution based on geographical decreased from 0.647 to 0.609. Please refer to Table 2 for specific values.
By plotting the trend of Gini coefficients for HHR from 2012 to 2021 (Fig. 2), it can be observed that both dimensions show a decreasing trend, with a more significant decrease in the population dimension. This indicates that the fairness level of HHR distribution in China is improving, especially regarding the population dimension. The Gini coefficient for the population dimension remains below 0.2 (except in 2013, when RN was higher by 0.001). It continues to decrease, indicating a fair and optimizing distribution of HHR regarding the population dimension. However, the Gini coefficient for the geographical dimension consistently remains above 0.6, indicating significant inequality in HHR allocation at the geographical dimension.
The Lorenz curves for HHR distribution from 2012 to 2021 demonstrate that the curves for both population and geographical dimensions have become less curved, resulting in a smaller residual area between the curves and the 45° line (representing absolute fairness). This suggests a trend towards fairer resource distribution. However, in comparison, the curve for the geographical dimension has a more significant curvature and shows noticeable differences from the curve for the population dimension. It is further away from the line of absolute fairness, indicating poorer fairness in HHR distribution in China’s geographical dimension. For detailed results, please refer to Additional File 1.

Gini coefficient trend of HHR in China from 2012 to 2021
Agglomeration degree
Based on the agglomeration degree results of HHR configurations in various regions (Additional file 2), in 2021, the HRAD values of HT in 14 regions such as Beijing (15.077) and Tianjin (8.750) were significantly greater than 1, indicating an excessive allocation of HT based on geographical in these regions, while the HRAD values of HT in 9 regions such as Qinghai (0.061) and Xinjiang (0.103) were less than 1, indicating an insufficient allocation of HT based on geographical in these regions. There is a significant disparity in the fairness of China’s HT allocation based on geography. However, there is a gradual improvement in the fairness of HT allocation based on geography in some regions. For example, Yunnan’s HRAD value for HT increased from 0.610 to 0.827, while Shanxi’s HRAD value decreased from 1.836 to 1.537. The HRAD/PAD values of HT in 16 regions, such as Beijing (1.658) and Tianjin (1.113), were more significant than 1, indicating a relatively sufficient allocation of HT based on population in these regions.
Conversely, the HRAD/PAD values of HT in 15 regions, such as Guangdong (0.864) and Jiangxi (0.850), were less than 1, indicating an insufficient allocation of HT based on population in these regions. Overall, the HRAD/PAD values of HT in most regions are close to 1, indicating a relatively reasonable fairness in China’s allocation of HT based on population. At the same time, the fairness of HT allocation based on population in some regions continues to improve. For example, Hebei’s HRAD/PAD value for HT increased from 0.873 to 0.943, while Beijing’s HRAD/PAD value decreased from 1.917 to 1.658 (Additional file 2: Table S1.2).
The HRAD values of L(A)P in 15 regions, such as Beijing (15.379) and Tianjin (9.753), were significantly greater than 1, indicating an excessive allocation of L(A)P based on geography in these regions. Conversely, the HRAD values of L(A)P in 8 regions, such as Qinghai (0.058) and Xinjiang (0.095), were less than 1, indicating an insufficient allocation of L(A)P based on geographical in these regions. There is a significant disparity in the fairness of China’s L(A)P allocation based on geography. However, there is a trend of gradual improvement in the fairness of L(A)P allocation based on geography in some regions. For example, Ningxia’s HRAD value for L(A)P increased from 0.720 to 0.760, while Jilin’s HRAD value for L(A)P decreased from 1.204 to 1.044. The HRAD/PAD values of L(A)P in 15 regions, such as Beijing (1.691) and Tianjin (1.241), were more significant than 1, indicating a relatively sufficient allocation of L(A)P based on population in these regions. Conversely, the HRAD/PAD values of L(A)P in 16 regions, such as Jiangxi (0.811) and Guangdong (0.829), were less than 1, indicating an insufficient allocation of L(A)P based on the population in these regions. Overall, the HRAD/PAD values of L(A)P in most regions are close to 1, indicating relatively good fairness in China’s allocation of L(A)P based on population. At the same time, the fairness of L(A)P allocation based on population in some regions continues to improve. For example, Gansu’s HRAD/PAD value for L(A)P increased from 0.859 to 0.933, while Beijing’s HRAD/PAD value for L(A)P decreased from 1.852 to 1.691 (Additional file 2: Table S1.3).
The HRAD values of RN in 15 regions, such as Beijing (14.488) and Tianjin (7.532), were significantly greater than 1, indicating an excessive allocation of RN based on geography in these regions. Conversely, the HRAD values of RN in 9 regions, such as Tibet (0.012) and Qinghai (0.057), were less than 1, indicating an insufficient allocation of RN based on geography in these regions. There is a significant disparity in the fairness of China’s RN allocation based on geography. However, there is a gradual improvement in the fairness of RN allocation based on geography in some regions. For example, Yunnan’s HRAD value for RN increased from 0.594 to 0.887, while Beijing’s HRAD value for RN decreased from 18.669 to 14.488. The HRAD/PAD values of RN in 20 regions, such as Beijing (1.593) and Shanghai (1.173), were more significant than 1, indicating a relatively sufficient allocation of RN based on population in these regions.
Conversely, the HRAD/PAD values of RN in 11 regions, such as Tianjin (0.958) and Hebei (0.849), were less than 1, indicating an insufficient allocation of RN based on population in these regions. Overall, the HRAD/PAD values of RN in most regions are close to 1, indicating relatively good fairness in China’s allocation of RN based on population. At the same time, the fairness of RN allocation based on population in some regions continues to improve. For example, Guizhou’s HRAD/PAD value for RN increased from 0.754 to 1.033, while Shanghai’s HRAD/PAD value for RN decreased from 1.435 to 1.173 (Additional file 2: Table S1.4).
Overall, there is a significant disparity in the fairness of China’s HHR allocation based on geography, while the allocation based on population is relatively reasonable. Furthermore, there is a trend of gradual improvement in fairness in both dimensions, consistent with the results of the Lorenz curve and the Gini coefficient.
